
Towards a Carbon Free Campus
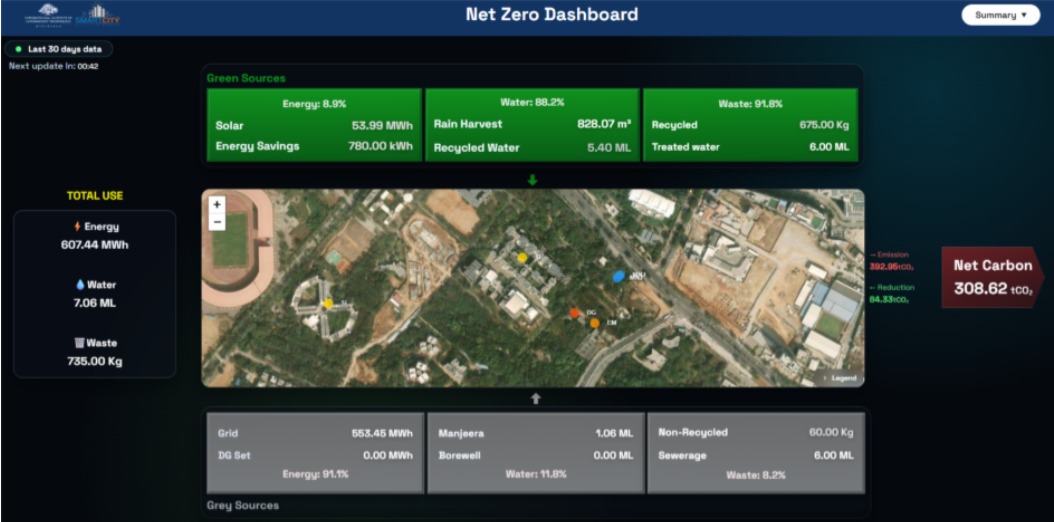
The Net Zero Dashboard is a web-based dashboard that analyses and visualises carbon emission, reduction, and sustainability metrics in real-time. Its main purpose is to help cities, organisations, or campuses measure their progress toward achieving net-zero carbon emissions, where the amount of greenhouse gases emitted is equal to the amount removed or offset. The three main sectors considered are energy consumption, water consumption, and waste generation.
Energy Consumption (Green & Grey Sources)
- Solar Generation: Renewable energy produced through on-site solar panels.
- Grid Consumption: Electricity drawn from the main power grid.
- DG Set Consumption: Diesel generator energy used during power outages.
Water Consumption (Green & Grey Sources)
- Rainwater Harvesting: Water collected from rainfall for reuse and groundwater recharge.
- STP Outflow: Treated water discharged from the Sewage Treatment Plant.
- Campus Outflow: Total wastewater leaving the campus boundary.
- Grey Water: Reusable wastewater from sinks and wash areas.
- Manjeera Consumption: Water sourced from municipal supply (Manjeera).
- Borewell Pumping: Groundwater extracted using borewell pumps.
Waste Generation (Green & Grey Sources)
- Recycled Waste: Waste materials diverted for recycling or reuse.
- Non-Recycled Waste: Waste sent to landfill or disposal without recovery.
Net Stats (CO₂ Emissions & CO₂ reduction)
The total carbon emissions are measured from grey sources across energy consumption, water consumption, and waste generation activities to track the overall carbon footprint.
-
Carbon Emission:
- Scope 1 (Direct Emissions): Fuel combustion, vehicles, on-site generators
- Scope 2 (Indirect Emissions): Purchased electricity, heat, and cooling
- Scope 3 (Other Indirect Emissions): Embodied carbon (construction, materials), Employee commute, Waste disposal, Water use etc.
-
Carbon Reduction:
- Reduce Emissions: Implement energy efficiency measures to lower CO₂ emissions
- Offset Emissions: Engage in reforestation to remove remaining CO₂
Our Implementation
A Net Zero Dashboard is designed and developed to align with the Greenhouse Gas Protocol Corporate Standard by enabling structured, scope-based greenhouse gas (GHG) accounting across institutional operations. The platform facilitates systematic classification and quantification of emissions under Scope 2 primarily w.r.t energy domain, presently with provisions for future integration of Scope 1 & Scope 3 emissions. It incorporates standardised emission factors and calculation methodologies to ensure accuracy, consistency, and transparency in emissions reporting.
Through real-time data acquisition from IoT-enabled infrastructure, the system generates a dynamic and auditable GHG inventory, supporting continuous monitoring and reporting. The platform also enables comprehensive tracking of emissions and offsets, allowing for net emissions assessment in alignment with Net Zero objectives.
Features
- Real-time monitoring of Energy, Water consumption and Waste generation across the infrastructure
- Carbon emission measurement and reduction through greenery and sustainability monitoring
- User-friendly dashboard to promote awareness, encourage sustainable behaviour, and towards carbon free campus goal.
- The Net Zero Dashboard helps the city be accountable and progress towards net zero, allowing the city to shift from static reports to active carbon management and measure carbon footprint & carbon reduction for reaching Net Zero goal.
